TL;DR
The Application Insights was configured to send the data twice to the Log Analytics workspace. One of them was done by ARM, the other was enforced by an Azure Policy. We turned off the Azure Policy and removed all upstream diagnostics settings on all Application Insights resources. This saved 100 euros monthly.
On a recent project, we encountered duplicate logging in Azure Application insights.
Problem introduction scope, and context
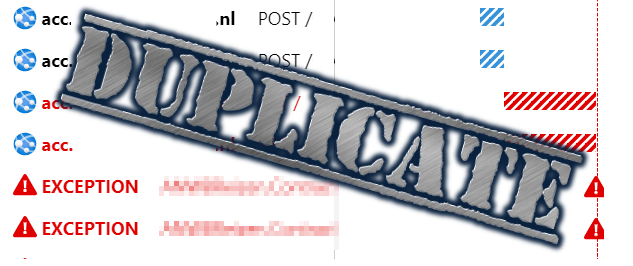
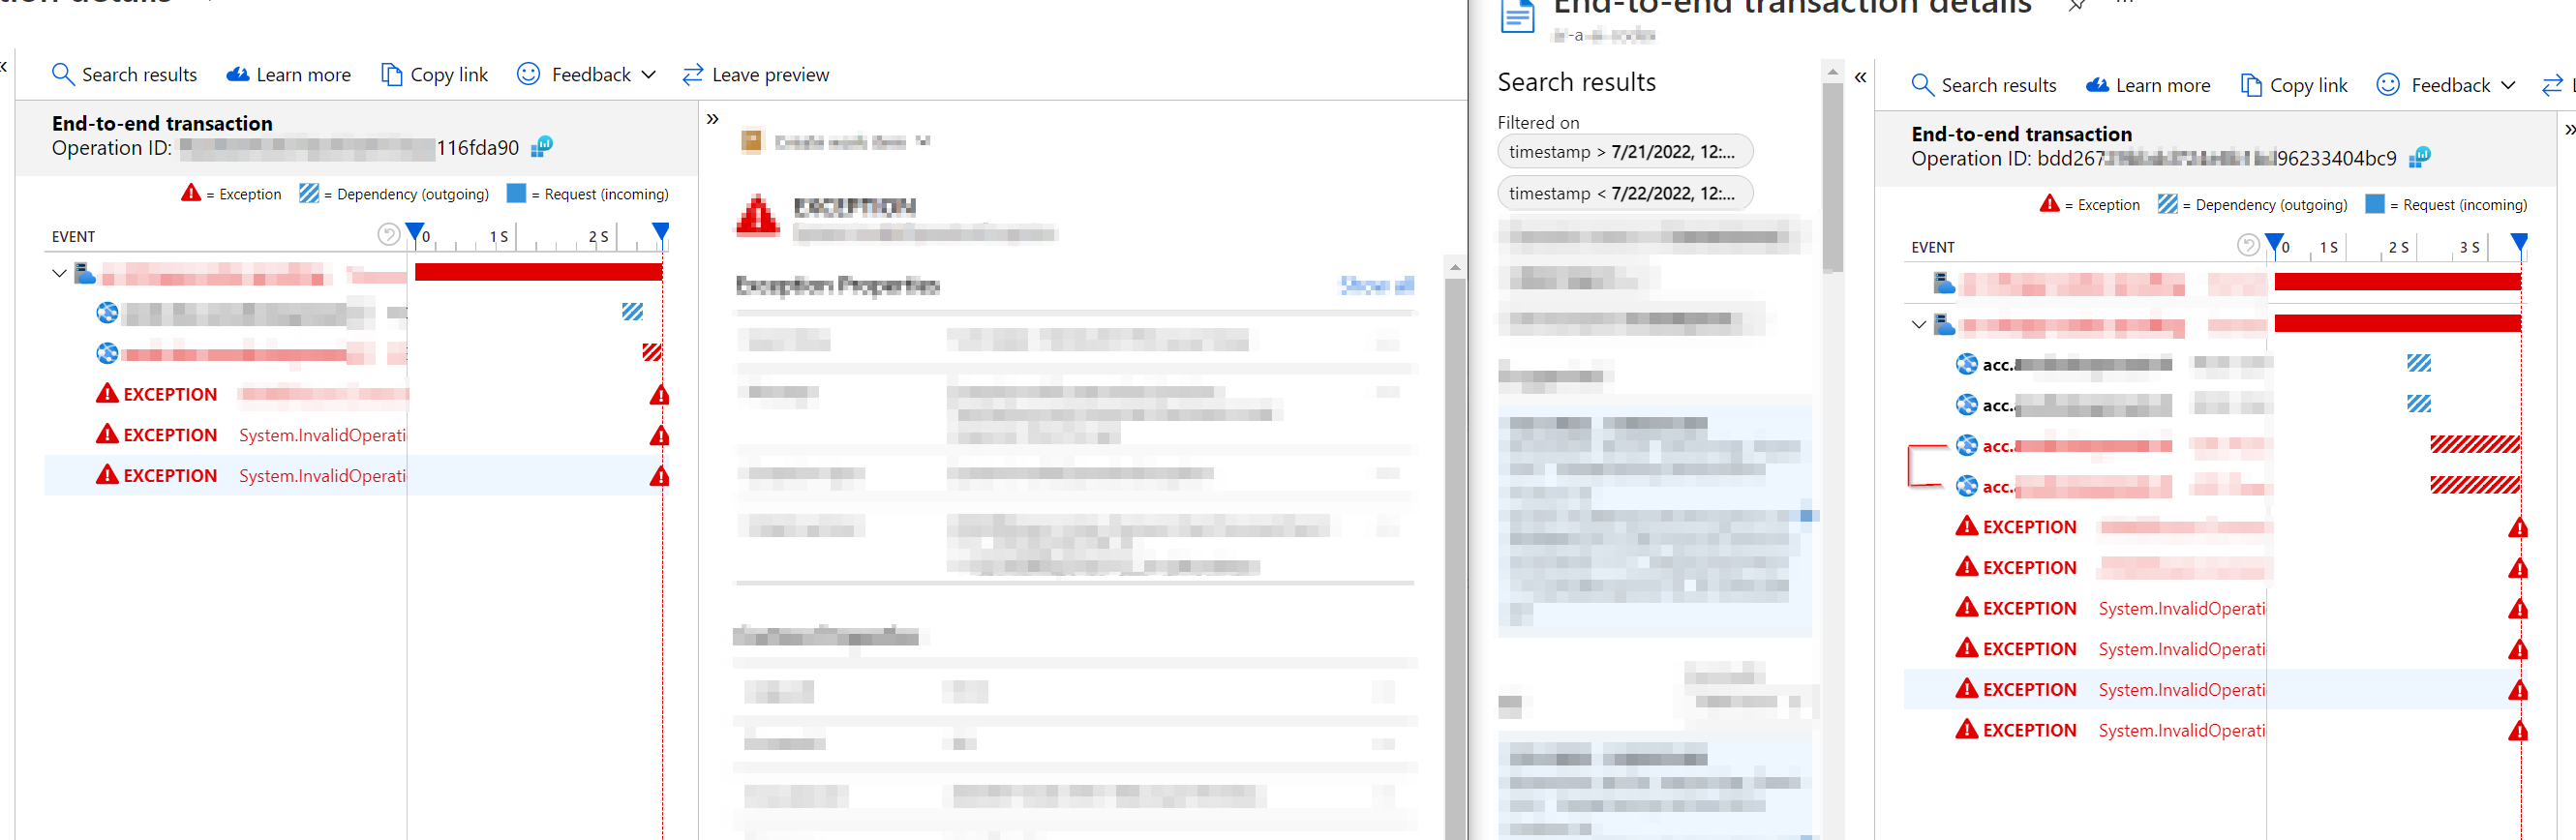
As seen in the screenshot we suffered in the acceptance environment with duplicate exceptions, information, and dependencies. In the development environment, on the left screen, we did not experience this issue.
Exclude the software error
To exclude the possibility of a software error, we executed these actions:
- Debugging the application and looking at the outgoing application insights tab.
- The Azure web app / Azure function is misconfigured.
- We tested web apps with a single instance. If a single instance generates duplicate logging, it’s surely not the instance count.
The cause
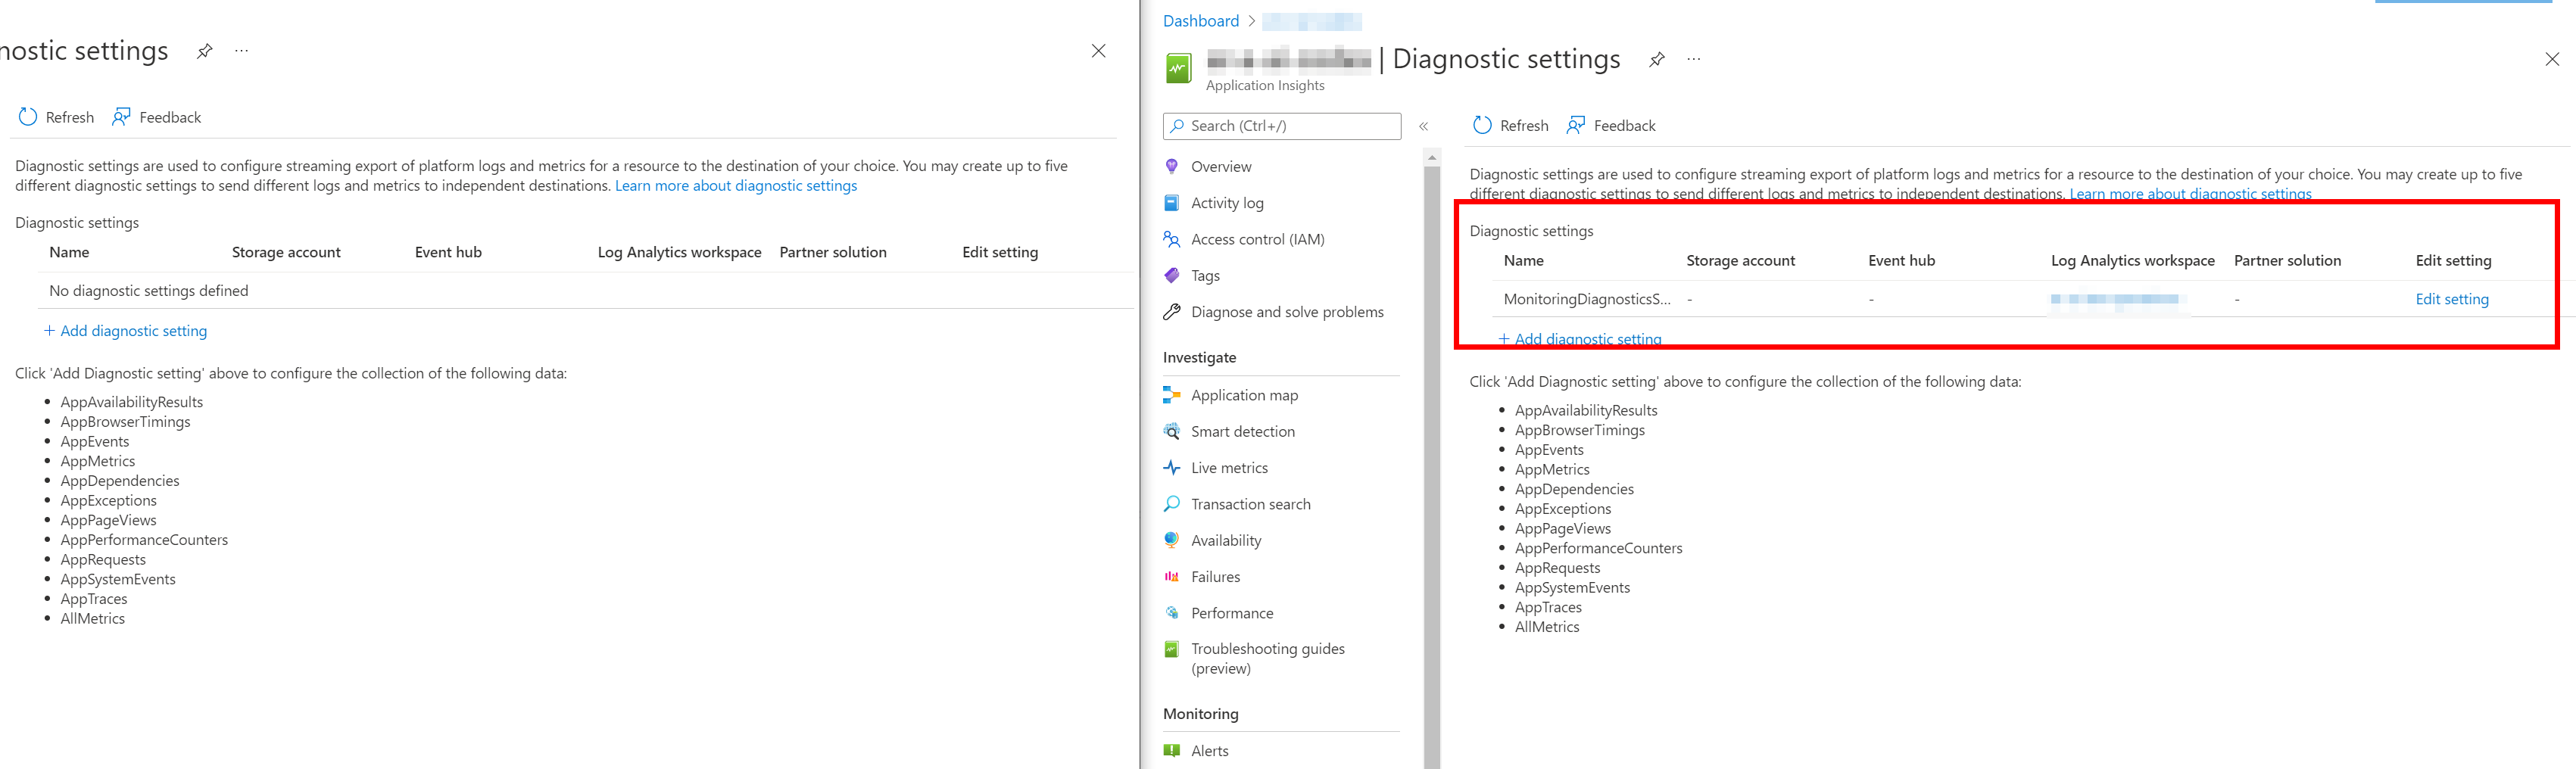
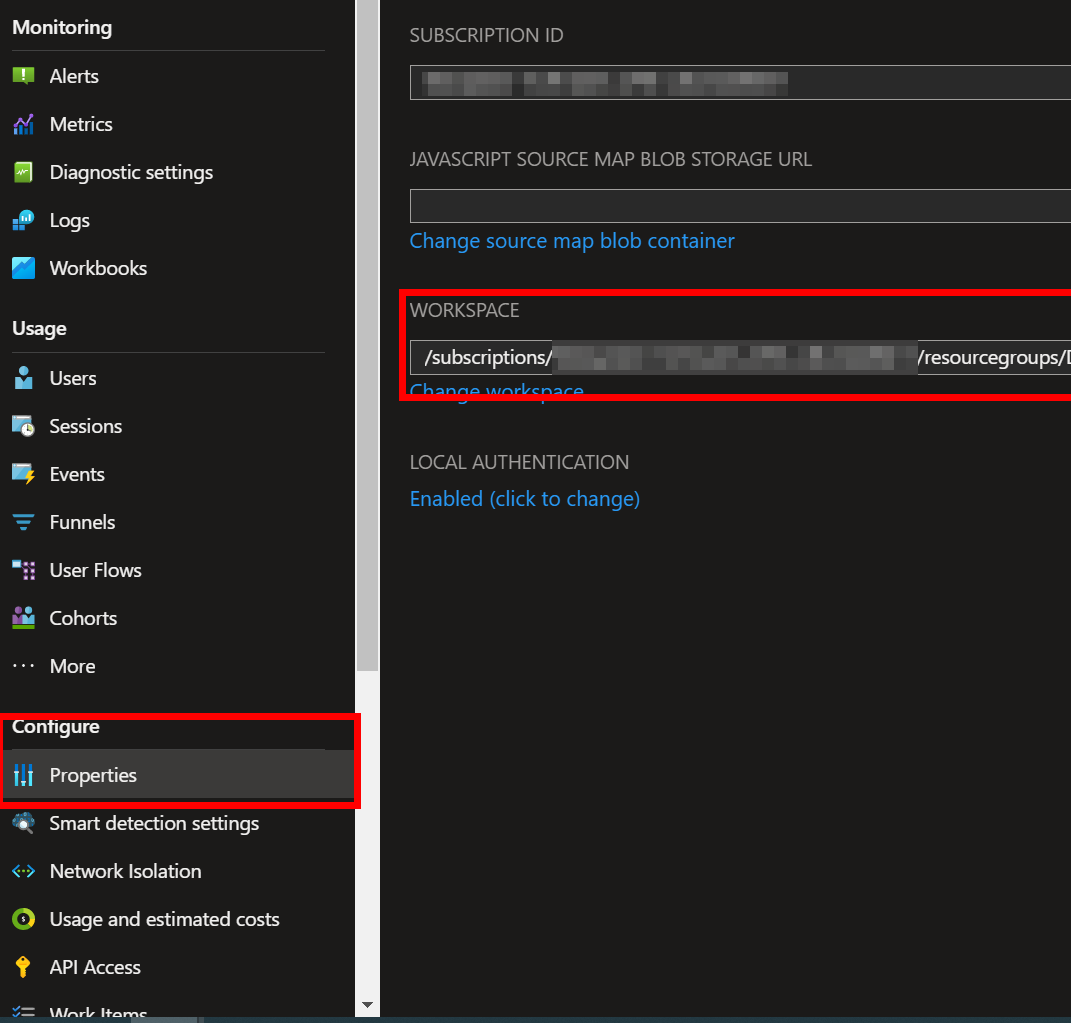
The Log Analytics Workspace was configured in diagnostic settings as well it was in the properties of the Application Insights. See the screenshots of the Azure portal.
 The screenshot below shows how the application insights resource is configured upstream.
So when we concluded the configuration was duplicate, we asked ourselves:
- Why was it duplicate configured, couldn’t that have been spotted in an existing ARM template?
- The answer consists of multiple factors and solutions. The two main components were an ARM template and an Azure Policy.
1. The correct way - ARM > Workspace property
The correct implementation of the properties was created by an ARM template. The infrastructure as code makes sure we’re configuring the upstream Log Analytics Workspace.
|
|
2. Azure Policy was enforced on ‘Diagnostic settings’
There also was an Azure policy checking that there was a diagnostic setting for sending data to the Log Analytics Workspace. Whenever the IT operations checked and enforced the Azure Policy, we would have duplicated the upstream to our Log Analytics Workspace.
We turned off this Azure Policy and removed all upstream diagnostics settings on all Application Insights resources.
Conclusion
Difference Application Insights and Log Analytics workspace
graph TD
AI1[Application Insights instance 1]
AI2[Application Insights instance 2]
LA1[Log Analytics Workspace]

LA1 <--- AI1
LA1 <--- AI2
Application Insights gives ‘insights’ into application logging, exceptions, and such. You can use the Kusto query language to fetch data intelligently from Application Insights. The Log Analytics workspace is a set of tables. For the client in this article, the data of the Application insights was forwarded to the Log Analytics workspace. The advantage of the Log Analytics workspace is to query over multiple Application insights as well as data about other resources in Azure, such as API management, application gateways, service busses, or firewalls.
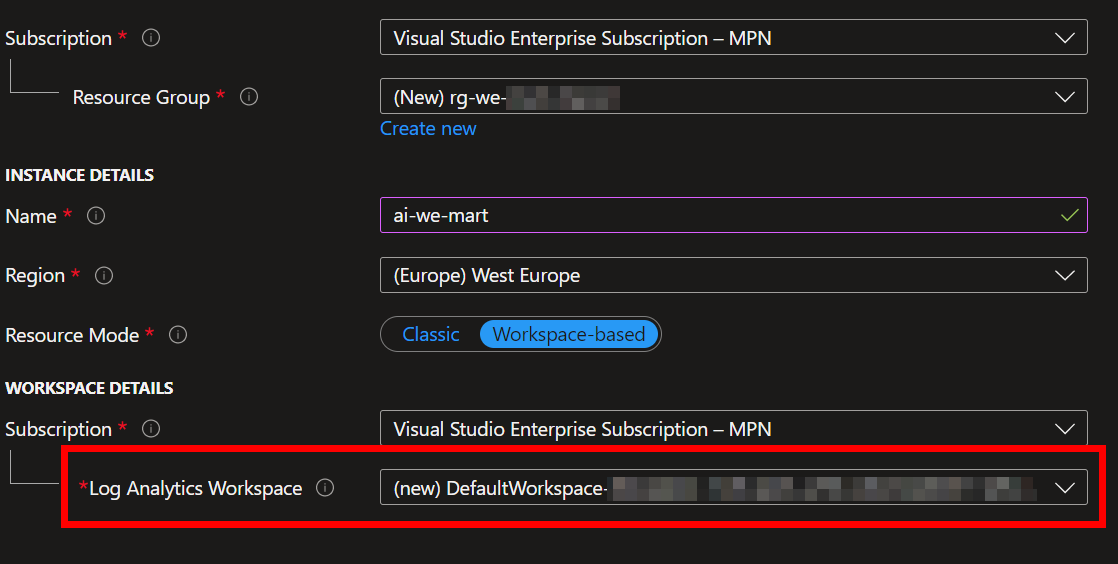
In the screenshot below is seen that when you create a new Application Insights resource the Log Analytics Workspace is configured automatically.
Cost analysis 💰
This change saved the client over €1000 monthly in Azure Log Analytic costs. The euros won’t tell you how much of the total it was. After fixing all duplicate configurations, the total costs of the Application Insights resources were reduced by roughly 40-50%. If you also are experiencing this problem, I hope this article helps. Good logging makes all developers happy.
Wrap up
Whenever you see duplicate logging in your application insights make sure the configuration is correct. Also, make sure that you’re not forcing a policy on the diagnostic settings when you configure it in the properties. Only one upstream to the Log Analytic workspace is required 😉.


